Map
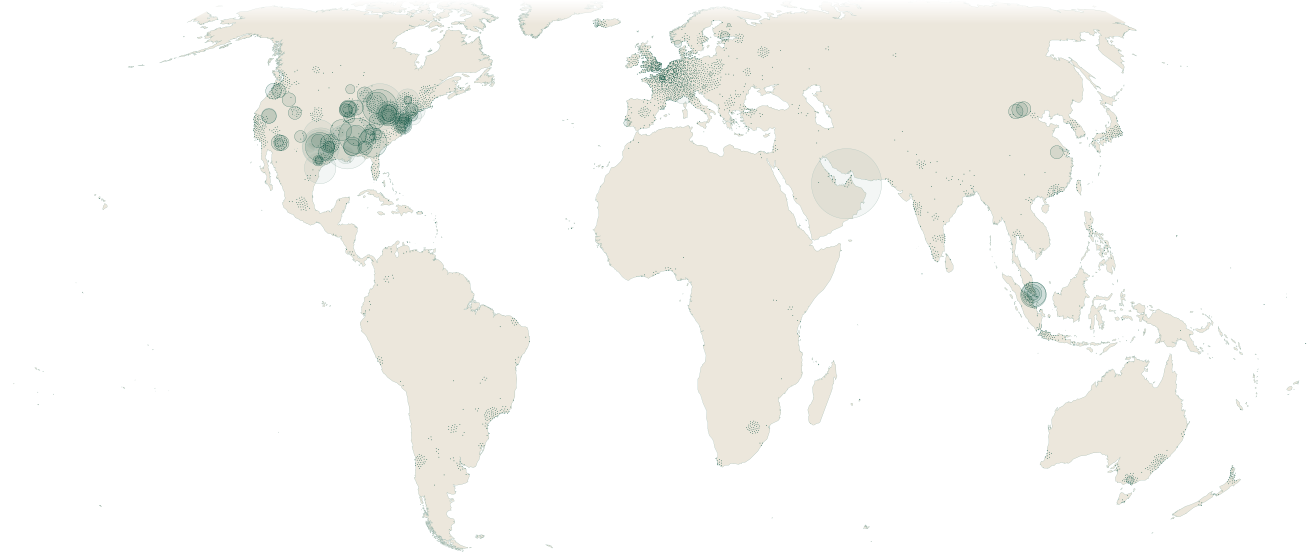
3,671 sites in 107 countries
Sites in view
3,671 sites, largest first.
The 3,671 sites on the map come from the 4,305 facility records open to browse in Facilities.
107 countries
- United States1,070
- France280
- Germany197
- United Kingdom181
- Netherlands132
 United
 France
 Germany
 United
 Netherlands
1,037 companies
 United
 Malaysia
Related pages
Sources
7 sources
- Epoch AI Frontier Data Centers: https://epoch.ai/data/data-centers
- IM3 / PNNL data-center corpus: https://www.openstreetmap.org/copyright
- PeeringDB facility registry: https://www.peeringdb.com/
- GridStatus: https://www.gridstatus.io/
- Operator filings and disclosures (SEC EDGAR, 20-F, press): https://www.sec.gov/edgar/search/
- Scrutica’s facility records: https://scrutica.com/methodology#data-sources
- Natural Earth (land, coast and borders): https://www.naturalearthdata.com/
Research cited
- Bobby Xiong, Davide Fioriti, Fabian Neumann, Iegor Riepin, Tom Brown, Prebuilt Electricity Network for PyPSA-Eur based on OpenStreetMap Data, Zenodo, 13 Nov 2024 (ODbL v1.0)
How the figures were made
Sites. The map draws on the 4,305 facility records open to browse; the 94 held under licence are left out. It counts each campus once, folding in 72 records that repeat one, which leaves 4,233 sites. It draws 3,671 of them, one mark a site: 561 have no coordinates, and 1 is left out as a second pin on one campus or as an OpenStreetMap record above 70° north that holds only a name and a position. The methodology sets out how a facility enters the corpus.
The world. The projection is Equal Earth, centred on the Greenwich meridian, which keeps areas true, so every region takes its true share of the map. The whole-world view runs from 74° north to 56° south. Land and coast are Natural Earth 1:10m, thinned at 1.2 km. Past about three times, the map names the countries its records sit in and draws pale land borders from Natural Earth 1:50m, which shows de facto boundaries. That outline holds to about 20 times; past it the coast fades and the land pales, so the deepest views show the sites and their places alone.
Circles. A circle’s area is proportional to the power its record states, and it keeps its size at every zoom, so sizes compare across views; at the whole-world view it is the size the site’s own record draws. A pale circle is a figure not counted as operating capacity: announced, permitted or under construction; expanding with no operating share recorded; retired; or a build-out figure with no operating plant recorded inside it. Where a record states more power than it operates, a dark circle for the operating figure sits inside the pale one. A hatched circle is a figure its record marks as an estimate.
Dots. A dot is a site with no power figure, pale where its record is not counted as operating capacity. At the whole-world view, dots that would overlap settle round their recorded position and stay on land, and where they crowd they draw smaller, so a dense region reads as texture; a dot can sit up to about 450 km from its record (median about 100 km). Zooming in returns dots to their records. A site with a circle never moves. When a filter or a search narrows the map, the sites it leaves out stay in grey.
Heat. A Gaussian density of the drawn sites on the equal-area plane, with a standard deviation of about 241 km. The lines stand at 0.5, 2 and 8 sites per 10,000 km².
EU grid substations. The layer’s substations come from PyPSA-Eur’s prebuilt network, version 0.6, derived from OpenStreetMap.
Entity List. The view draws in copper the sites whose records name a company that matches the Entity List, by the test the company’s own record prints a match by: a match at a confidence of 0.85 or more that has not been withdrawn. A site tied to the list only through a parent company or its address is not drawn in copper; its record shows those findings.